Guaranteed Higher Grade!
Free Quote

This laboratory report deals with the microbial testing of Sauerkraut and Your hurt in order to identify the “number of mesophilic aerobes, coliforms and LAB” in each of the given food samples. This laboratory report also focusses on the determination of “percentage of lactic acid” produced in every given sample by using phenolphthalein as an indicator.
Sauerkraut is the most prevalent and oldest fermented foods in entire Western Europe which are mainly produced by fermentation of fresh cabbage. As fresh cabbage is the habitat of the various microbial community therefore largely contains Mesophilic aerobes and coliforms bacteria. But on fermentation, the number of these two microbial communities decreases and due to change in pH number of lactic acid bacteria (or LAB) increases in the final mixture of sauerkraut. Moreover, yoghurt also contains a large number of LAB as it is produced by the fermentation of milk product (Vasiee et al., 2018). Hence, the purpose of this microbial testing is to determine the “number of LAB, coliforms and mesophilic aerobes” in each of the food products along with the “amount of lactic acid” produced in each of the samples.
NA agar, PCA agar, MacConkey agar, pH meter, phenolphthalein, spreader, Petri dish, test tube, beaker, distilled water, Bunsen burner, LAF
Method: The methodology for doing the entire lab report is the same as the procedure which was previously provided in the class. No changed in any of the procedure, dilution and time have been made while doing the microbiological experiments.
3.0 Result
3.1 Determination of LAB by Spread plate method
|
Sample |
Duplicate spread Plate count at different dilution |
||||||
|
|
10-1 |
10-2 |
10-3 |
10-4 |
10-5 |
10-6 |
10-7 |
|
Sauerkraut |
4 |
0 |
0 |
|
|
|
|
|
Day 0 |
2 |
0 |
0 |
|
|
|
|
|
Sauerkraut Day 7 |
|
|
TNTC TNTC |
TNTC TNTC |
327
338 |
26
34 |
1
3 |
|
Yoghurt |
0
0 |
0
0 |
65
73 |
13
14 |
1
0 |
0
0 |
0
0 |
Table 1: Number of colonies formed by LAB by Spread plate method
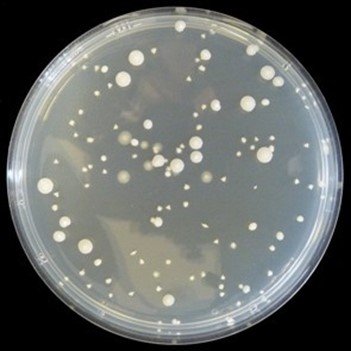
Figure 1: Colonies formed by Spread plate method in Yoghurt (10-3) dilution plate
Therefore, for the calculation of Colony Forming Unit for LAB in each of the food samples:
CFU= (Number of colonies in each of the plate)/ (Total volume plate X Total dilution used)
|
Food Sample |
No. of Set |
Dilution |
Number of colonies |
|
Sauerkraut Day 0 |
Set A |
10-1 |
(40)/ (1ml X 10-1) = 400 colonies |
|
Set B |
10-1 |
(20)/ (1ml X 10-1) = 200 colonies |
|
|
Sauerkraut Day 7 |
Set A |
10-5 |
(327)/ (1ml X 10-5) = 327X 105 colonies |
|
Set B |
10-5 |
(338)/ (1ml X 10-5) = 338X 105 colonies |
|
|
Set A |
10-6 |
(26)/ (1ml X 10-6) = 260X 105 colonies |
|
|
Set B |
10-6 |
(34)/(1ml X 10-6)= 340X 105 colonies |
|
|
Set A |
10-7 |
(1)/(1ml X 10-7)= 100X 105 colonies |
|
|
Set B |
10-7 |
(3)/(1ml X 10-7)= 300X 105 colonies |
|
|
Yoghurt |
Set A |
10-3 |
(65)/(1ml X 10-3)= 65X 103 colonies |
|
Set B |
10-3 |
(73)/ (1ml X 10-3)= 73X 103 colonies |
|
|
Set A |
10-4 |
(13)/ (1ml X 10-4) = |
|
|
|
|
130X 103 colonies |
|
Set B |
10-4 |
(14)/(1ml X 10-4)= 140X 103 colonies |
|
|
Set A |
10-5 |
(1)/(1ml X 10-5)= 100X 103 colonies |
Table 2: CFU calculation for determination of the number of LAB in every sample
|
Sample |
Duplicate spread Plate count at different dilution |
||||||
|
|
10-1 |
10-2 |
10-3 |
10-4 |
10-5 |
10-6 |
10-7 |
|
Sauerkraut Day 0 |
142
129 |
23
27 |
0
0 |
|
|
|
|
|
Sauerkraut Day 7 |
|
|
TNTC TNTC |
TNTC TNTC |
TNTC TNTC |
329
343 |
30
35 |
|
Yoghurt |
0
0 |
0
0 |
0
0 |
57
52 |
7
3 |
0
0 |
0
0 |
Table 3: Colonies formed by Mesophilic aerobes in PCA pour plate method
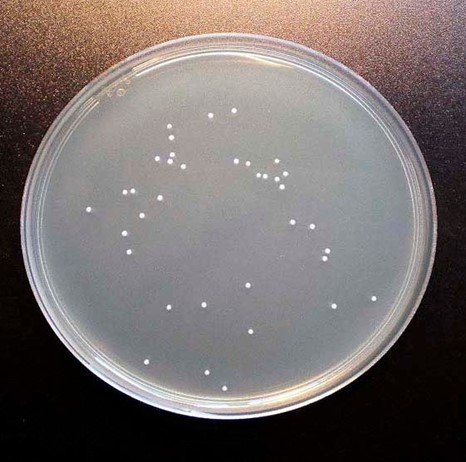
Figure 2: Colonies formed by PCA plate method in Sauerkraut Day 7 (10-7) dilution plate
Therefore, for the calculation of colony-forming unit of mesophilic aerobes in every given food sample:
|
Food Sample |
No. of Set |
Dilution |
Number of colonies |
|
Sauerkraut Day 0 |
Set A |
10-1 |
(142)/ (1ml X 10-1) = 1420 colonies |
|
Set B |
10-1 |
(129)/ (1ml X 10-1) = 1290 colonies |
|
|
Set A |
10-2 |
(230)/ (1ml X 10-1) = 2300 colonies |
|
Set B |
10-2 |
(270)/ (1ml X 10-1) = 2700 colonies |
|
|
Sauerkraut Day 7 |
Set A |
10-6 |
(329)/ (1ml X 10-6) = 329X 106 colonies |
|
Set B |
10-6 |
(343)/(1ml X 10-6) = 343X 106 colonies |
|
|
Set A |
10-7 |
(30)/(1ml X 10-7) = 300X 106 colonies |
|
|
Set B |
10-7 |
(35)/(1ml X 10-7) = 350X 106 colonies |
|
|
Yoghurt |
Set A |
10-4 |
(57)/ (1ml X 10-4) = 57X 1043 colonies |
|
Set B |
10-4 |
(52)/(1ml X 10-4)= 52X 104 colonies |
|
|
Set A |
10-5 |
(7)/(1ml X 10-5) = 70X 104 colonies |
|
|
Set B |
10-5 |
(3)/(1ml X 10-5) = 30X 104 colonies |
Table 4: CFU calculation for determination of the number of mesophilic aerobes in every food sample
|
Food Sample |
Number of Coliforms |
|
Sauerkraut Day 0 |
(0, 0, 0) |
|
Sauerkraut Day 7 |
(0, 0, 0) |
|
Yoghurt |
(0, 0, 0) |
Table 5: Result for number of coliforms using MacConkey Broth
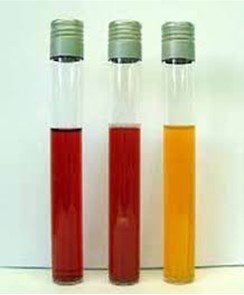
Figure 3: Result of MPN broth
3.4 pH and Titration
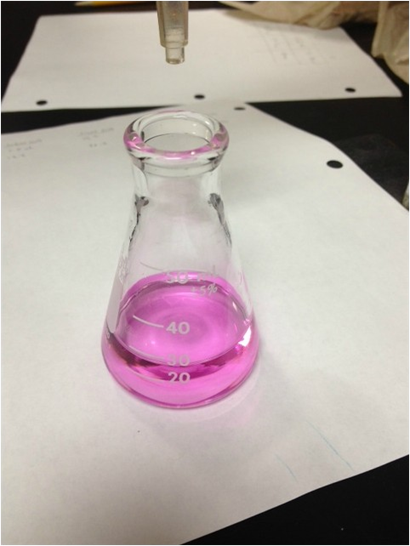
Figure 4: Titration by phenolphthalein
|
Sample |
pH value |
Titre value |
|
Sauerkraut Day 0 |
5.55 |
0.1ml |
|
Sauerkraut Day 7 |
3.57 |
4.0ml |
|
Yoghurt |
4.15 |
6.0ml |
Table 6: pH and % of lactic acid (titration value) for every food sample
For the calculation of % of lactic acid in the considered food samples:
% of Lactic acid= (“titre/ml X molarity of NaOH X mol. Mass of lactic acid”)/(“ml of sample X10”)
|
Sample |
Percentage of Lactic acid |
|
Sauerkraut Day 0 |
(0.1 X 0.1 MX 90.08)/ (5X 10) = 0.0180 % |
|
Sauerkraut Day 7 |
(4.0 X 0.1 MX 90.08)/ (5X 10) = 0.7206 % |
|
Yoghurt |
(6.0 X 0.1 MX 90.08)/ (5X 10) = 1.0809 % |
Table 7: Calculation of lactic acid in the food samples
The intrinsic property of Sauerkraut and Yoghurt do change the microflora in the samples. Yoghurt is a fermented product of milk and thus will contain a greater number of LAB compared to Sauerkraut which contains more aerobic bacteria. Moreover, if the fermentation was continued, the pH of Sauerkraut would have fallen more as the number of LAB would have increased in the mixture. The result of MNP clearly states that there was no coliform in the given samples. But the temperature at which the MPN method was sacred out may give other bacterial growth such as Bacillus. Further, the best approach for coliform detection is the MPN method as the test provides a colour change in the MPN broth upon coliform detection. Hence, MPN provides advantages over the traditional plate method as by MPN coliform bacteria can be easily detected and differentiated from other aerobic bacteria growing at 37°C. The pH and titre value
ratio of both the simple was almost similar as both the samples contained LAB as the primary microbial community.
Alpaslan, E., Geilich, B.M., Yazici, H. and Webster, T.J., 2017. pH-controlled cerium oxide nanoparticle inhibition of both gram-positive and gram-negative bacteria growth. Scientific reports, 7(1), pp.1-12.
Khan, M.I., Mukherjee, K., Shoukat, R. and Dong, H., 2017. A review on pH sensitive materials for sensors and detection methods. Microsystem Technologies, 23(10), pp.4391-4404.
Lee, S., Lee, S., Singh, D., Oh, J.Y., Jeon, E.J., Ryu, H.S., Lee, D.W., Kim, B.S. and Lee, C.H.,
2017. Comparative evaluation of microbial diversity and metabolite profiles in doenjang, a fermented soybean paste, during the two different industrial manufacturing processes. Food chemistry, 221, pp.1578-1586.
Taylor, B.C., Lejzerowicz, F., Poirel, M., Shaffer, J.P., Jiang, L., Aksenov, A., Litwin, N., Humphrey, G., Martino, C., Miller-Montgomery, S. and Dorrestein, P.C., 2020. Consumption of fermented foods is associated with systematic differences in the gut microbiome and metabolome. Msystems, 5(2).
Vasiee, A., Behbahani, B.A., Yazdi, F.T., Mortazavi, S.A. and Noorbakhsh, H., 2018. Diversity and probiotic potential of lactic acid bacteria isolated from horreh, a traditional Iranian fermented food. Probiotics and antimicrobial proteins, 10(2), pp.258-268.
Wuyts, S., Van Beeck, W., Oerlemans, E.F., Wittouck, S., Claes, I.J., De Boeck, I., Weckx, S., Lievens, B., De Vuyst, L. and Lebeer, S., 2018. Carrot juice fermentations as man-made microbial ecosystems dominated by lactic acid bacteria. Applied and environmental microbiology, 84(12).

Get original papers written according to your instructions and save time for what matters most.
Order Now